Perceptualisation using a Tactile Mouse
R.G. Hughes and A.R. Forrest
University of East Anglia,
School of Information Systems, Norwich NR4 7TJ, UK
e-mail: rgh@sys.uea.ac.uk, forrest@sys.uea.ac.uk
ABSTRACT
Whilst there has been considerable effort in constructing force feedback devices for use in virtual
environments, and in the use of touch as a prosthesis for the blind, there has been little work on
the use of touch in the visualisation or more properly, perceptualisation of data. Touch
potentially offers an additional dimension of perception where visualisation is limited by screen
size, resolution, and visual overload. In this paper we describe some tactile mice and experiments
in using tactile mice for a variety of perceptualisation tasks.
1 INTRODUCTION
In their comprehensive and instructive book on visualisation techniques Keller and Keller [12]
classify problems in terms of the number of dependent and independent variables. Figure 1 lists
most of the examples in their book. As we might expect the majority of examples are for data for
which there is a single dependent variable whilst the number of independent variables ranges
from 1 to 4. Typically the independent variables are associated with space and time. There are
very few examples where the number of dependent variables exceeds 3 (Keller and Keller
include examples with 11 variables, 21 variables, 12 dependent variables with 4 independent
variables, and 20 dependent variables with 1 independent variable, but these examples are treated
in a rather different way from others in the book). We might ask why problems with more than 3
dependent variables are infrequent. One possible explanation lies in the use of graphics. We can
assign factors such as size, orientation, colour and glyph to the dependent variable dimensions
but two difficulties intrude: the low resolution and small size of typical screens can induce visual
clutter, and the human visual system may simply be presented with too much data to absorb.
Screen size and resolution seem unlikely to increase to match conventional visualisation systems
such as engineering drawings and maps, so visual clutter is likely to remain a problem for the
foreseeable future. In our work at the University of East Anglia we have sought to extend the
possible range of problems which can be visualised by investigating first the use of sonification
[17, 18] and more recently touch. Our hope is that by this means we can extend the
dimensionality of data which can be visualised or more properly perceptualised.
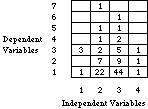
Figure 1: Examples of Visualisation Problems Classified by Dependent and Independent
Variables
2 MOTIVATION
In the early 1970's, one of the authors experimented with a computer peripheral for rapid
production of three-dimensional models machined from rigid plastic foam [9], a precursor of
rapid prototyping first implemented by Bézier [3]. One of the models made during that era is
shown in Figure 2. It represents two 4x4 arrays of bicubic surface patches. In the pre-Bézier/B-
spline era, surfaces were defined in Hermite form, necessitating the specification of cross-
derivative vectors at patch corners. These so-called twist vectors were difficult to understand and
in practice it was common simply to set them all to zero. The resulting surfaces were known to
have a lack of fairness although it was difficult to illustrate this by conventional graphics. The
model in Figure 2 was an attempt to demonstrate this effect. The left "bump" is the uniform
bicubic B-spline basis function; the right "bump" is nearly similar but has all the twist vectors set
to zero: as can be seen, the two are visually indistinguishable. However, running a finger or
thumb around the bumps reveals a very distinct local flattening at some of the patch corners
where the twist vectors are zero. Once these regions are isolated by touch it is possible with some
care to orient the model such that the viewing direction and appropriate lighting will show up the
flattening visually.
In another case, the experimental ship hull in Figure 3 was cut in order to show a lack of fairness
which was thought to exist in one part of the hull but which had not shown up on conventional
cross-section plots. The model revealed not only the expected anomaly but also another lack of
fairness in a different part of the hull, to the surprise of the data suppliers. Three-dimensional
hard copy is often overlooked as a method of rendering or visualising complex shapes, but
clearly the scope for interaction and manipulation is limited.

Figure 2: Bicubic Surface Patches: left-hand bump is a bicubic B-spline basis function, right-
hand bump is similar except that all "twist" vectors are set to zero
Figure 3: Ship Hull Example: 3D hard copy revealed lack of fairness at bow and stern when
touched
These two examples illustrate a procedure common in everyday life: running one's hand over a
surface such as car body or a yacht hull is a good test of the overall quality of the surface. Touch
provides two distinct perceptions in this case: an indication of the roughness or texture of the
surface, and an indication of the fairness or variation of surface curvature.
Our initial aim was to mimic this kind of tactile perception in an ergonomic manner, but we also
felt that touch could be used to convey other forms of information not normally associated with
touch. We felt that this could be achieved by combining touch transducers with a desktop mouse,
thus bringing touch to the user of an average workstation without imposing the constraints on the
user which are generally mandated by immersive virtual reality and force-feedback touch
systems.
3 ASPECTS OF TOUCH
Touch is a complex sense [21], and includes the sensation of wetness, temperature, and the
experience of pain. Loomis and Lederman [16] classify touch using the terms "tactile perception"
(touch mediated solely by cutaneous stimulation), "kinesthetic perception" (mediated exclusively
or nearly so by variations in kinesthetic stimulation, i.e. motion or muscular effort), and "haptic
perception" (tactual perception combining cutaneous and kinesthetic sensation). Haptic
perception is the most common form of tactual perception. Many processes are involved, see for
example the literature on the psychophysics of touch [15, 16, 22]. The characteristics of the
various tactual mechanisms indicate that some mechanisms are quite limited both spatially and
temporally, but other mechanisms can be extremely precise. For example, if an area of skin is
stimulated by an array of points, then the spatial resolving power of tactual perception is rather
poor, but an engraver can control the position and depth of engraving to amazingly high
precision.
We have deliberately confined our interest to touch mediated by vibrational or other stimulation
or displacement of the skin. This enables us to use simple, inexpensive and unconstrained touch
devices which can be combined ergonomically with conventional interaction devices such as the
mouse. Kinesthetic and haptic devices, by contrast, operate in a limited volume, or require the
user to wear special equipment or other wise constrain the user, and are generally expensive.
4 PREVIOUS WORK
Outside of the computing community, haptic displays and devices have been developed to act as
artificial ears for the deaf [13, 14, 20] or artificial eyes for the blind [4, 7, 8]. These devices have
had limited success due to the limited temporal response of the tactual perception mechanisms in
the case of artificial ears and the limited spatial discrimination in the case of systems for the
blind. Because our work is not concerned with prosthetic use of touch but with the additional
perception afforded by touch in synergy with hearing and vision, these devices are of little
relevance to our explorations.
In the computing community, touch has generally meant either the input of position by touching
(touch sensitive screens, for example), or by pressing (pressure-sensitive tablets and drawing
tools) [6], or the use of force feedback to give the illusion of contact or weight in manipulating
virtual objects or real objects using remote manipulators [5, 19]. Force feedback generally
requires the input device to be mechanically linked to some anchorage or attached to the user and
consequently rather limits the space within which it can operate. Early examples are described by
Batter and Brooks and by Geyer and Wilson [2, 10]. Geyer and Wilson discuss a proposed
"Magic Glove" which not only inputs positional information to the computer but conveys a sense
of touch by "numerous computer controlled small gas jets which push at different positions on
the fingers and palm in response to calculations of their positions relative to the simulated
external object world." We have not been able to determine whether this proposal was ever put
into effect, and, if it was, whether it proved useful for visualisation.
Akamatsu and Sato [1] describe a mouse with tactile and force feedback, tactile sensation being
provided by a small pin with approximately 1mm travel which is used as a binary touch
indication, and force feedback being generated by adding resistance to mouse motion by means
of an electromagnet. The forces generated are obviously restricted and given the propensity of
mice to stick, may be annoying to the user rather than informative.
Whilst most previous work on touch has been aimed at kinesthetic perception for virtual reality
applications, our work has concentrated on tactile perception for perceptualisation of data.
5 TACTILE MICE
In order to pursue our research we have experimented with a number of different mice using
different technologies to provide the sensation of touch. They are all based on modified Apple
Macintosh mice and are activated by the sound channel of a Macintosh Quadra 950 using
standard Macintosh sound functions. Our mouse designs were inspired by the roller mouse built
by Apple and described by Venolia [23] which mounts two rollers, one on each side of the
mouse button, and is thus controlled quite naturally by the first and third fingers. The advantage
of concentrating on tactile perception using a mouse is that the user is virtually unrestricted in
movement and the sensors are naturally to hand when needed whereas kinesthetic and haptic
devices require either a fixed position for the device or for the device to be physically attached to
the user. However, incorporating a tactile transducer on a mouse restricts the size and type of
transducer that can be employed: for example, tactile arrays {4, 7] are, for our purposes and
budget, impractical. Use of the sound channels to drive the tactile transducers leads to simplicity
and reduced cost.
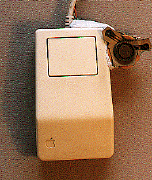
Figure 4: Mono Vibrotactile Mouse
Mono-Speaker Mouse
An audio speaker of the kind typically found incorporated in a personal computer can be used as
a device to transmit vibrotactile information, however, such a speaker in its unaltered state is too
big to attach to a mouse. A speaker was stripped down until all that remained was the coil and
the magnet with its casing. This proved to be sufficiently small and light enough to be attached
as a vibrotactile pad to the front right-hand side of an Apple single-button mouse so that the
fourth finger of a right-handed user rests naturally on it, Figure 4. The pad is driven by a sound
channel via a simple amplifier.
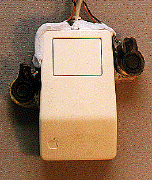
Figure 5: Stereo Vibrotactile Mouse
Stereo-Speaker Mouse
The stereo vibrotactile mouse which was built was designed for use by a right handed user with
the vibrotactile pads positioned so that the thumb rests on the left pad whilst the fourth finger
rests on the right pad, Figure 5. The vibrotactile pads were constructed in the same manner as for
the mono-speaker mouse: each was positioned so that it just avoided contact with the surface
over which the mouse was to be moved. This means that the thumb and fourth finger are still
free to control the mouse whilst receiving tactile stimulation. The use of two vibrotactile pads
increased the weight of the mouse considerably, although users soon became accustomed to this
increase in weight.
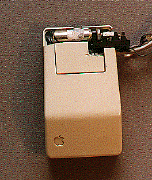
Figure 6: Mono Solenoid Mouse
The Solenoid Mouse
As an alternative to using a modified speaker as a vibrotactile pad, we experimented with a
solenoid which was placed along the front edge of the mouse after some reshaping of the upper
casing, Figure 6. The solenoid was driven once again by the sound output from the Macintosh.
The solenoid mouse has the advantage that its vibration is more comfortable for the user and its
strength can be manually controlled by varying the power used to drive it. Users preferred the
lower power settings which also reduced the noise generated by the solenoid. The main
disadvantage over the other two mice is that, due to the nature of a solenoid, the amplitude of
vibration is fixed.
Other Tactile Transducers
We are continuing to experiment with other transducers. A dot-matrix printhead, for example,
provides the opportunity to experiment with variations in vibration impossible with a solenoid,
relying on the low spatial resolution of the finger so that multiple pin activation can be sensed as
intensity rather than being spatially discriminated. Alternatively, sequential activation of a
sequence of pins can be used to indicate the sense of `up' or `down'. We have had some success
with a transducer based on transcutaneous electrical nerve stimulation (administered as a mild
electric shock). This, whilst not always popular with users, has some potential and in particular
does not generate sound which can be intrusive with the speaker-based transducers. Both Bliss et
al. [4] and Cholewiak et al. [7] describe matrix devices using piezoelectric transducer arrays
which would be difficult to build in to a mouse. Our limited experience of piezoelectric devices
used singly was unsatisfactory, but these devices might still prove to be suitable given good
engineering resources. Users generally preferred the solenoid mouse due to its low noise and
comfort of use although the electric shock mouse had one devotee.
6 EXPERIMENTS IN PERCEPTUALISATION
We describe here two from a range of experiments which we have conducted. One uses touch as
a binary output from the computer and the other maps data to a range of vibrational frequencies.
Our intention in discussing these experiments here is to demonstrate that touch can be used to
perceive information rather than to demonstrate that touch is better than other senses for certain
tasks. Full details of the experiments are given in [11].
Needle in the Haystack Experiment
Simple preliminary experiments had shown that the tactile mouse could aid the user in moving to
a specified area of the screen even when both the target area and the mouse pointer could not be
seen. The aim of the needle in the haystack experiment was to determine whether tactile
perception could speed up the location of a single element in a complex display. The scene
resembled a random scattering of straws, all of the same length except one which was smaller.
Visually, the smaller straw was difficult to detect in the screen clutter.
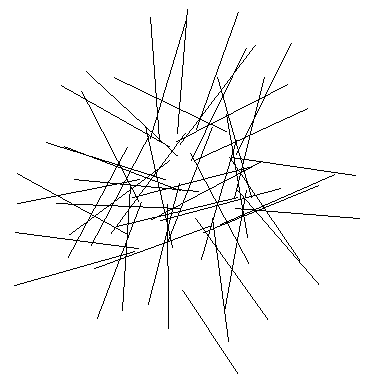
Figure 7: Typical Haystack Image
Each subject was initially placed in front of a monitor with a blank window at its centre. Once
the mouse button was clicked a timer was started and 50 lines 125 pixels long and one 100 pixels
long were placed at random positions and angles within the window as in Figure 7. The subjects
were then required to find the shorter line by eyesight alone, and to identify it by moving the
mouse pointer over it and depressing the mouse button. If the correct line was chosen, the timer
would be stopped and the window cleared, otherwise searching would continue until the correct
line was found. The searching process was then repeated a second time except that on this
occasion the subject was assisted by use of a vibrotactile mouse: when the mouse pointer moved
across the shorter line the mono-vibrotactile pad was vibrated at a pre-set frequency.
Subjects who took part in the experiment were required to participate in an untimed practice at
finding the line both aided by and unaided by the vibrotactile mouse so that they could become
accustomed to the task they were required to perform. Each subject was then asked to complete
the experiment with and without the vibrotactile mouse three times and the time taken was
recorded for each attempt. In total 22 subjects took part in the experiment of whom 9 were
regular users of mice and 13 were not. The average results for each subject are shown in Figure
8.
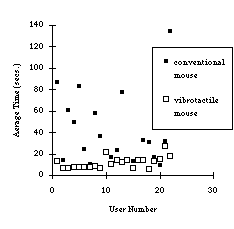
Figure 8: Haystack results.
The average time taken to find the shorter line using the vibrotactile mouse was 30% of the
average time taken when using the conventional mouse. However, the figure for those familiar
with a mouse was 17% compared with 42% for users who were unfamiliar with the use of a
mouse: users not familiar with using a mouse had more difficulty in controlling the vibrotactile
device. Curiously, our experienced mouse users were generally poorer at visual recognition of
the shorter line. There was much less variation in the timings using the tactile mouse. This is
probably due to the users adopting a systematic sweeping search of the image when searching by
touch whilst using a random technique using vision alone, hoping in this case for instantaneous
recognition.
Of course, we could have distinguished the shorter line by visual means such as blinking, colour,
intensity, line thickness or other visual attributes, in which case identification would have been
instantaneous or nearly so. Identification by sound rather than touch might well be quicker or
simpler. Our aim here was simply to demonstrate that visual clutter could be overcome by tactile
means and hence could be used to extend the number of attributes that could be used to identify
multidimensional data.
A Visual/Tactile Display for Multi-Dimensional Map Data
As Geographical Information Systems (GIS) become more popular, the range and volume of data
available increases. In cartography colour, line styles, and glyphs are used conventionally to
identify different aspects of data. Nowadays, users commonly wish to overlay two or more sets
of map data at the same time. For example, one may wish to know simultaneously how many
people live in an area and the radiation levels due to a power station near by. Various
conventional methods exist to display overlapping data, but none really allow an exact overlay
whilst avoiding visual clutter. Side-by-side display is of course an option but has a serious
disadvantage for GIS where small screen size is already a problem.
The Vibro Map Software
A possible solution to this problem is to view one of the maps on the screen as it would normally
be displayed and overlay on it an invisible tactile map. This map could be felt using a
vibrotactile mouse. One possible mapping of the overlay map data into tactile stimuli values
would be to translate the colour scale in the map so that blue areas induce no vibration and red
areas induce high vibration, Figures 9 and 10.
Software was developed on the Macintosh to perform this task. Simple square sound waves were
created using a sample editor package This sample was then used as a resource within the
program. (Samples were used to prepare for future versions of the program which will use the
stereo vibrotactile mouse for location on one tactile channel and value on the other.)
The program has just three main options. The first loads the image which is to be displayed on
the screen, for example Figure 9. The second option loads an image and stores it in an off screen
bit map, (Figure 10 shows a typical example in visual form). The final option enables the user to
explore the off screen bit map in tactile mode. Once this option has been selected the mouse
becomes `live'. As the mouse is moved over the on-screen bit map the corresponding colour
value in the off screen bit map is converted into a number which is interpreted by the system as a
frequency of vibration of the tactile transducer on the mouse. Colours are mapped in spectral
order.
The initial system appeared to work quite well, but it suffered from the problem that because data
values could alter considerably from pixel to pixel, it was quite difficult to appreciate what
information the mouse was transmitting except when the mouse was still. This problem was
alleviated by adding a smoothing function: 10 frequency values are sampled during a set time
period and averaged to produce the actual vibration felt. This means that as the user moves over
a mainly red region and then briefly touches a green pixel, this will hardly be felt. However if
the user moves over the area slowly, then the change will be felt. When the smoothing system is
used it is much easier to understand the data For example, it proves to be quite easy to find an
area in which there may be, say, both high population and high radiation.
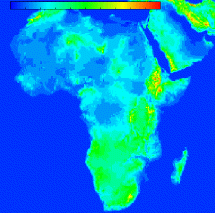
Figure 9: Displayed Map (depicting elevation)
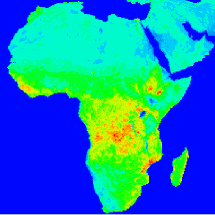
Figure 10: Hidden Map, Sensed by Touch (depicting vegetation)
The main problem with the current system is that although the user can identify qualitative
changes in the data, it is difficult to determine the actual values. A tactile scale on the screen,
similar in form to the colour coded scale in Figure 9, has been implemented and can be used to
aid comprehension. Training in the use of the system increases user awareness of changes in
levels and frequencies of vibration. An alternative option would be to encode digits as vibrations:
the mouse could then be sent a stream of digits to denote an exact value.
It has been found that a user can distinguish the values on the overlaid map with the assistance of
the scale to quite a high degree of accuracy. Even on their first attempt some users correctly
chose the right value on the overlaid map (values ranged between 0 and 100) and most users can
perceive the value to within 5% on a regular basis.
8 CONCLUSIONS
It has proved difficult to find touch generating devices which are entirely satisfactory and this
has inhibited integration of a touch module as part of a visualisation system along the lines of our
previous incorporation of a sound module in NCSA Image [18]. It has also made it difficult to
explore the somewhat limited range of tactile values which can be distinguished by mapping data
values onto parameters such as frequency and amplitude of vibration. We have not yet attempted
to simulate roughness and curvature to emulate the tactile perception afforded by the solid
models mentioned in Section 2. Fairness or curvature sensation perhaps requires haptics, but
roughness could be simulated by vibration. Nevertheless, we claim useful improvements to
perceptualisation can be achieved by tactile means and improved transducers will simply serve to
expand the useful range of tactile effects which can be exploited.
Users can perceptualise the two tactile dimensions of the stereo mouse; it is not clear whether
overload would occur if all fingers were independently stimulated by tactile pads. Our
experiments suggest that touch can potentially increase the dimensionality of data that can be
perceived by two dimensions. Our experiments also indicate that touch is a good agent for
reinforcing other sensations. Earlier experiments with sound [17, 18] showed that four channels
of sound could be tracked simultaneously. Whether sight, sound and touch can usefully be
employed simultaneously for high-dimensional perceptualisation is still an open question.
Concentrating on one simple aspect of touch, tactile perception, leads to a relatively simple and
ergonomic device. Since touch, unlike vision, is essentially a localised and serial sense, the
combination of tactile output with a pointing device such as a mouse is quite natural, thus
enabling tactile exploration on a location by location basis in conjunction with the overall
perception of displayed data afforded by sight. Our initial results are encouraging and we believe
touch has a place in the visualisation of complex data where visual complexity or limited display
area is a hindrance to visualisation. Touch may also find an application where menus or control
buttons may need to be hidden in order not to impair visualisation of an image.
9 ACKNOWLEDGEMENTS
We wish to acknowledge Apple Computer Advanced Technology Group, Cupertino, for
providing computing equipment and software tools, the Computing Studies Sector, UEA and the
UK Engineering and Physical Sciences Research Council for financing the studies of one of the
authors, and Dr Charles Lang for the use of archive material.
10 REFERENCES
- Akamatsu, M. & Sato, S. A Multi-modal Mouse with Tactile and Force Feedback.
International Journal of Human-Computer Studies, Volume 40, Number 3, March 1994,
pages 443-453.
- Batter, J.J. & Brooks, F.P. Jr. GROPE-1: A Computer Display to the Sense of Feel.
Proceedings of IFIP 1971, North-Holland Publishing Company, 1972, pages 759-763.
- Bézier, P.E. "Numerical Control in Automobile Design and Manufacture of Curved
Surfaces.". In Curved Surfaces in Engineering, Ed. L.J.I. Browne, I.P.C. Science and
Technology Press, Guildford, March 1972, pp. 44-48.
- Bliss, J.C., Katcher, M.H., Rogers, C.H. & Shepard, R.P. Optical-to-Tactile Image
Conversion for the Blind. IEEE Transactions on Man-Machine Systems, Volume MMS-11,
Number 1, March 1970, pages 58-65.
- Brooks, F.P. Jr., Ouh-young, M., Batter, J.J. & Kilpatrick, P.J. Project GROPE-Haptic
Displays for Scientific Visualization. Computer Graphics, Volume 24, Number 4, August
1990, pages 177-185.
- Buxton, W.A.S., Hill, R.D. & Rowley, P. Issues and Techniques in Touch-Sensitive Tablet
Input. Proceedings, Graphics Interface '85, Canadian Information Processing Society,
Montreal, Quebec, May 1985, pages 147-149.
- Cholewiak, R.W. & Sherrick, C.E. A Computer-controlled Matrix System for Presentation
to the Skin of Complex Spatiotemporal Patterns. Behavior Research Methods and
Instrumentation, Volume 13, Number 5, 1981, pages 667-673.
- Craig, J.C. & Sherrick, C.E. Dynamic Tactile Displays. `Tactual Perception: A Sourcebook',
Eds. W. Schiff and E. Foulke, Cambridge University Press, 1982, Chapter 6, pages 209-
233.
- Forrest, A.R. A Computer Peripheral for Making Three-Dimensional Models. Automatisme,
Volume 19, Nos. 6/7, June/July 1974.
- Geyer, K.E. & Wilson, K.R. Computing with Feeling. Proceedings of the IEEE
Conference on Computer Graphics, Pattern Recognition and Data Structure, May 1975,
pages 343-349.
- Hughes, R.G. The Development and Use of Tactile Mice in Visualisation. Forthcoming
Ph.D. Thesis, University of East Anglia, Norwich, England, 1996.
- Keller, P.R. & Keller, M.M. Visual Clues: Practical Data Visualization. IEEE Computer
Society Press, 1993. ISBN 0-8186-3102-3
- Kirman, J.H. Tactile Communication of Speech: A Review and an Analysis.
Psychological Bulletin, Volume 80, Number 1, 1973, pages 54-74.
- Kirman, J.H. Current Developments in Tactile Communication of Speech. `Tactual
Perception: A Sourcebook', Eds. W. Schiff and E. Foulke, Cambridge University Press,
1982, Chapter 7, pages 234-262.
- Lederman, S.J. The Perception of Texture by Touch. `Tactual Perception: A Sourcebook',
Eds. W. Schiff and E. Foulke, Cambridge University Press, 1982, Chapter 4, pages 130-
167.
- Loomis, J.M. & Lederman, S.J. Tactual Perception. In `Handbook of Perception and
Human Performance, Volume 2, Cognitive Processes and Performance', K.R. Boff, L.
- Kaufman & J.P. Thomas, John Wiley and Sons, New York, 1986, Chapter 31, pages 31-1-
31-41.
- Minghim, R. & Forrest, A.R. Sound Mapping for Surface Visualisation. In Proceedings
of the Third International Conference in Central Europe on Computer Graphics and
Visualisation 95, Ed. V. Skala, Plsen, Czech Republic, February 1995, Volume II, pages
410-420.
- Minghim, R. & Forrest, A.R. An Illustrated Analysis of Sonification for Scientific
Visualisation. In Proceedings of IEEE Visualization '95, Ed. G.M. Nielson and D. Silver,
Atlanta, Georgia, October 29- November 3, 1995, IEEE Computer Society Press, 1995,
pages 110-117.
- Minsky, M.R., Ouh-young, M., Steel, O., Brooks, F.P. Jr. & Behensky, M.R. Feeling and
Seeing: Issues in Force Display. Computer Graphics, Volume 24, Number 2, March 1990,
pages 235-243. (Special Issue on 1990 Symposium on Interactive 3D Graphics, Snowbird,
Utah, March 1990.)
- Reed, C.M., Durlach, N.I. & Braida, L.D. Research on Tactile Communication of
Speech: A Review. ASHA Monographs 20, May 1982.
- Schiff, W. & Foulke, E. Tactual Perception: A Sourcebook. Cambridge University Press,
1982.
- Sherrick, C.E. & Craig, J.C. The Psychophysics of Touch. `Tactual Perception: A
Sourcebook', Eds. W. Schiff and E. Foulke, Cambridge University Press, 1982, Chapter 2,
pages 55-81.
- Venolia, D. Facile 3D Direct Manipulation. Human Factors in Computing Systems,
INTERCHI '93 Conference Proceedings, ACM SIGCHI and IFIP, Eds. S. Ashlund, K.
Mullett, A. Henderson, E. Hollnagel & T. White, Amsterdam, Addison-Wesley, April 1993,
pages 31-36, 547.
CGP Vis '96